Graph(s) of the week: expensive ships or a big fleet – you may only pick one
Posted By Andrew Davies on January 25, 2013 @ 05:00
 [1]
[1]For the first graph of 2013 we’re going back to a topic that has been exercising the minds of force planners around the world for decades: how can we keep up with the rising unit cost of military platforms? The short answer is ‘we can’t’, except by expending an ever greater proportion of national wealth on military equipment, and the graphs below tell the story.
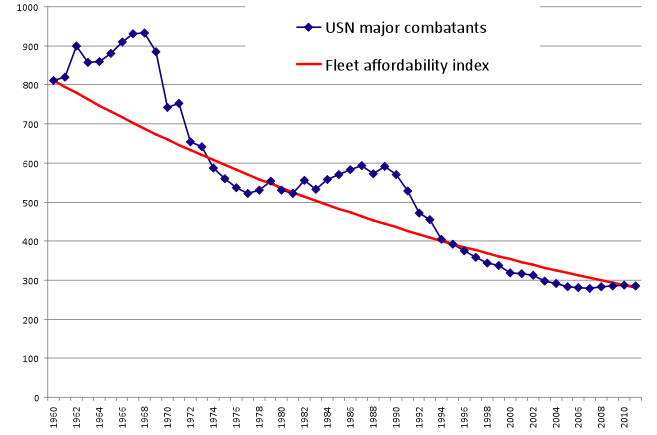
In the first figure, the blue data points are the number of major combatants in the USN from 1960 to the current date. The red line—labelled the ‘fleet affordability index’—is the number of vessels that would be expected if the USN had fixed buying power across the period. It shows how the USN’s fleet would be expected to decline if the sole driver was the increasing cost of vessels. It’s calculated by taking the RAND Corporation’s estimate of the increasing real cost of naval vessels [2]—a 2.1% real increase per annum—and compounding it. As the curve shows, the USN bucked the trend for a while as the Vietnam War was at its peak in the late 1960s, and again in the Reagan build-up years of the 1980s. But economics has a habit of coming back to bite, and as defence spending returns to the long term trend, so too the fleet size inexorably heads back towards the ‘line of fixed buying power’ represented by the fleet affordability index.
 [3]Sources: USN fleet size from http://www.history.navy.mil/branches/org9-4.htm [4]. Cost index curve from RAND Corporation estimates of unit price increase.
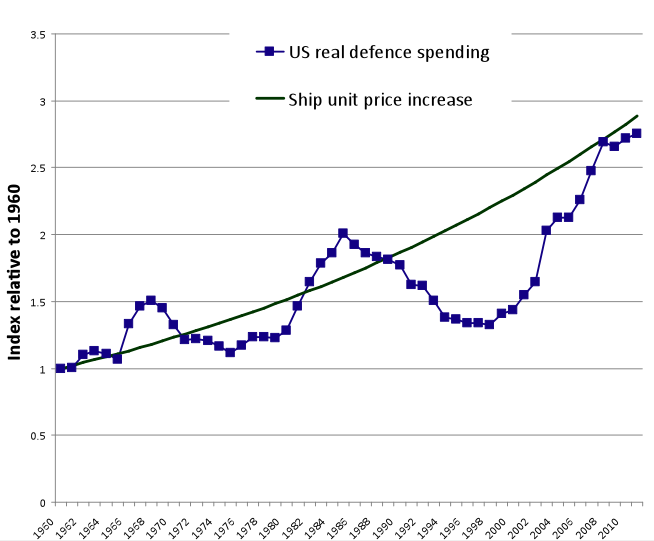
In each of the periods of fleet growth, American spending on defence as a proportion of GDP was increased for a few years. The second graph below shows real US defence spending indexed to the 1960 budget, on the same chart as the rising growth in the cost of naval vessels. During the Vietnam and Reagan years, the budget got ahead of the unit cost curve, allowing for an expansion of the Navy. After the end of the Cold War it fell well behind, hence the steady tailing off of the fleet size. The surge in spending since 2001 is a little misleading in this context, because a lot of it has gone into supporting two land wars and the USN has been only a modest beneficiary of the additional funds. In the years to come, it will be interesting to see if the focus on the predominantly maritime Asia-Pacific theatre and the associated AirSea Battle concept will see the USN bounce back. But in an era where ‘austerity’ seems to be the by-word, I wouldn’t be betting on it.
 [5]
[5]Source: US defence spending figures from Pentagon budget papers 2012 ‘Green Book’ [6] (PDF).
Andrew Davies is a senior analyst for defence capability at ASPI and executive editor of The Strategist. Image courtesy of Flickr user Official US Navy Imagery [7].
Article printed from The Strategist: https://www.aspistrategist.org.au
URL to article: https://www.aspistrategist.org.au/graphs-of-the-week-expensive-ships-or-a-big-fleet-you-may-only-pick-one/
URLs in this post:
[1] Image: http://www.aspistrategist.org.au/wp-content/uploads/2013/01/8112498530_98c728f8fd_c.jpeg
[2] estimate of the increasing real cost of naval vessels: http://www.rand.org/pubs/monographs/MG484.html
[3] Image: http://www.aspistrategist.org.au/wp-content/uploads/2013/01/Picture-13.png
[4] http://www.history.navy.mil/branches/org9-4.htm: http://www.history.navy.mil/branches/org9-4.htm
[5] Image: http://www.aspistrategist.org.au/wp-content/uploads/2013/01/Picture-15.png
[6] Pentagon budget papers 2012 ‘Green Book’: http://comptroller.defense.gov/defbudget/fy2013/FY13_Green_Book.pdf
[7] Official US Navy Imagery: http://www.flickr.com/photos/usnavy/8112498530/in/set-72157625799410352
Click here to print.