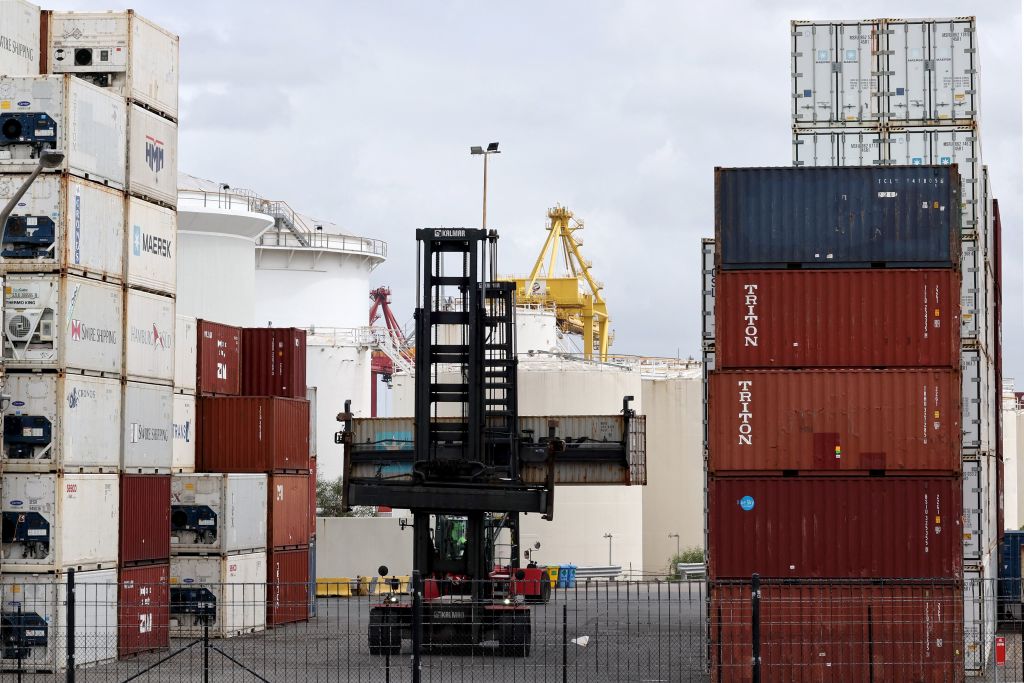
The hack into the systems of ports operator DP World at the weekend exposes Australia’s high dependence on containerised imports for manufactured goods.
Walk into any Bunnings, Harvey Norman, Officeworks, Myers or K-Mart store, and nearly everything you see has been imported in a container.
Australia’s own manufacturing sector, which still employs just under a million people and accounts for about 5.5% of the economy, similarly depends on imports packed into containers for a large share of its inputs, from the nuts and bolts to the pumps, motors and fabricated-metal products.
The Australian Financial Review cited estimates that the forced shutdown of the system managing DP World’s interface with trucking carriers resulted in about 30,000 containers being stranded, with trucks unable to get containers into its parks or out.
While the container shipping industry is crucial to Australia, we are a relatively unimportant to it, representing a small share of the global trade. Almost half of the containers that arrive in Australia full are returned empty.
The advent of the shipping container was one of the driving forces of globalisation, vastly increasing the ease of loading and unloading ships and integrating maritime and land transport. In 1990, about 200 million tonnes of goods were carried globally by container. By 2021, that had risen to just under 2 billion tonnes.
China is the behemoth of container shipping. Of the world’s top 100 container ports, according to a list compiled by Lloyd’s List in London, 24 are Chinese. Combined, they handle the equivalent of 260 million 20-foot containers a year.
Ports in the North Asian manufacturing centres of Japan, South Korea, Taiwan and Hong Kong handle 80 million containers a year, while the Southeast Asian ports are responsible for a further 100 million.
Although Australia is highly dependent on containerised shipping, it is ports are small by global standards. In 2022, Melbourne ranked 62nd on the global list, handling 3.3 million containers, and Sydney, ranking 76th, handled 2.8 million. According to the UN Conference on Trade and Development (UNCTAD), Australia accounts for 1.1% of global container throughput.
The shipping navigation website VesselFinder shows that, at present, there are about 70 container ships either heading for Australia or berthed in one of our container ports. Most are coming from North Asia—China, South Korea, Japan, Taiwan and Hong Kong; the other main originating ports are in Singapore and Malaysia.
Container ships do regular rotations through the Australian ports. In 2020–21, there were 311 container ships doing the Australian run, making a total of 1,484 visits to country with 3,705 port calls, according to data compiled by the Bureau of Infrastructure and Transport Research Economics. The average ship carries about 4,600 containers (based on the standard 20-foot container measure).
The port operators provide the link between the shipping and land transport. Ships book a slot at one of their wharves, the containers are moved to parks, and trucking carriers book to collect their containers once they have been cleared by customs. It is a technology-intensive business, with systems to manage the physical booking of wharf and crane slots, container park storage and trucks, as well as the documentation of container contents.
DP World and Patrick Terminals both operate container terminals in Brisbane, Sydney, Melbourne and Fremantle. Hutchison Ports has terminals in Brisbane and Sydney, Victoria International Container Terminal has one in Melbourne and Flinders Adelaide has the monopoly in Adelaide. The five capital city container ports handle about 92% of container throughput, with small volumes at Darwin, Townsville and Bell Bay.
An insight into the extent of Australia’s reliance on shipped manufactured imports is given by the database of port-to-port trade compiled by the Australian Border Force. Just in the month of July 2023, 113,000 consignments were imported to Australia by sea at a cost of $27.8 billion.
Of those, 31,100 came from China, with a total cost (including freight) of $7.3 billion. There were 4,720 consignments from Japan, worth $2.5 billion, and 2,180 from South Korea, worth $1.4 billion. They cover a vast variety of industrial inputs and consumer goods that find their way into every nook and cranny of the economy.
The Productivity Commission’s recent inquiry into Australia’s maritime logistics system noted that cargo flows involved almost 3,000 uniquely identified commodities. More than 40% of them involve the trade each year of less than 1,000 tonnes, equivalent to about 70 container loads.
While Australia’s imports mainly arrive in containers, bulk carriers are used to ship most of our exports, whether that’s resources like iron ore or agricultural commodities like barley and wheat. The same trade database shows 27,800 export consignments in July, of which 10,000 represented mineral or agricultural commodities most likely to be shipped in bulk. Together they represented almost 90% of the value of exports.
Some export agricultural commodities, like wool and cotton, are packed in containers, while meat and dairy products are shipped in refrigerated containers. Resource commodities like aluminium ingot can also shipped by container. However, Australia’s containerised manufactured goods are small relative to imports.
Australia and New Zealand are a special run for the shipping lines—they’re not on the way to anywhere. A central feature of globalisation is the manufacture of goods across several nations, but Australia has little participation in these global supply lines. Parts made in Australia for the F-35 fighters and for Boeing are an exception.
UNCTAD measures how connected a country’s container shipping is to other nations and compiles an index based on the number of ship calls, their carrying capacity, the number of liner companies servicing the country and the number of other countries connected through direct liner shipping services.
China tops the ranking, followed by South Korea, Singapore, Malaysia and the United States. Australia’s score has been improving, but it ranks a lowly 57th, just ahead of Argentina and the Congo, but below Togo, Chile and the Ivory Coast.

