For the past couple of years I’ve been keeping Strategist readers updated with the status of USAF planning for procurement of the F-35A Joint Strike Fighter at each pentagon budget cycle. (See here for 2013 and 2014.) When the Pentagon budget papers were released in March of this year I re-did the analysis. It’d be unseemly and uncollegiate of me to blame the blog editing team for misplacing my submission, but the blog editing team misplaced my submission. So, six months late, here is the ‘latest’ look at the USAF’s F-35 budget plans.
The story this year is that the trends identified in the past couple of updates are holding. The USAF is planning to acquire more than 250 aircraft in the next five years, and the prices they expect to pay are pretty stable. Figure 1 shows the planned production numbers from the nine most recent budget requests. The delays in ramping up production in the early years (the part of the graph labelled ‘slippage’) have now disappeared.
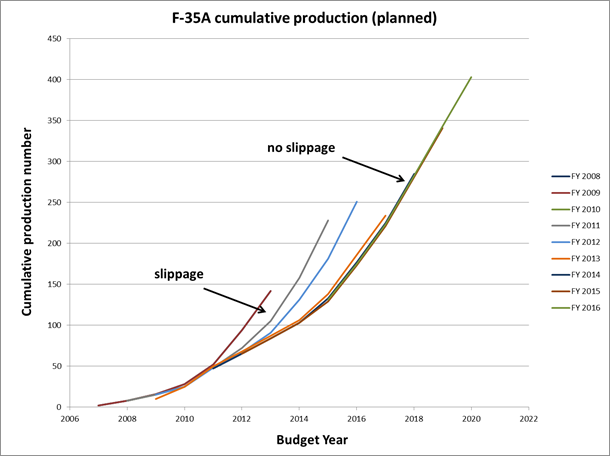
Source: USAF budget requests FY2008 through FY2016
The increased production rate’s important for the RAAF because they’re looking to get the bulk of their aircraft later this decade and early next. To get the best deal (and the most effective aircraft), the higher the production rate and the more stable the design the better.
The second graph shows why the numbers produced matter. It plots the budgeted flyaway (aircraft only) cost from the past four budget requests, along with an industry standard learning curve. Each time the production quantity doubles, the cost reduces to 80% of the previous figure. So the 100th aircraft is 80% of the cost of the 50th, the 200th is 64% and the 400th is a little over half the price of the 50th. I fitted the learning curve to the production cost of the 50th aircraft, and the agreement with the budgeted costs is pretty good. (For those who care about such things, there’s a description of learning curves in a previous post, with the applicable formulae in a footnote.)
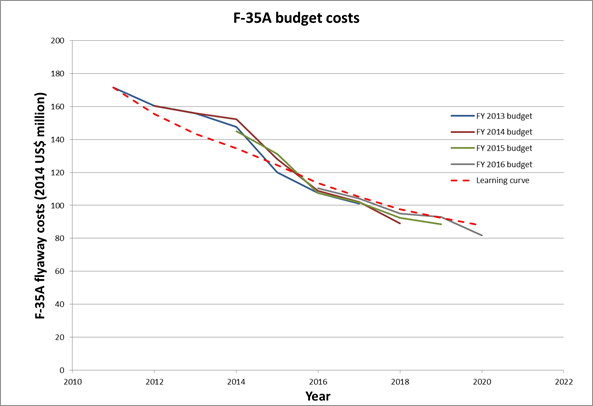
Source: USAF budget requests FY2008 through FY2016 and ASPI calculations
I have to add the caveat that the future figures are probably based on learning curve calculations, so there’s a danger of circularity in the argument. But the actual—as opposed to budgeted—figures from the past few years show a strong decline in costs, albeit a little slower than the learning curve would predict.
If I had to get my crystal ball out and make predictions, I’d suggest that production numbers will be pretty much as predicted, but actual costs will be a little higher than the current budget figures suggest. That’s because the USAF faces a ‘make or break’ period as far as recapitalising its tactical aircraft fleet is concerned (see my previous analysis here). Provided that cost increases don’t spiral out of control—and there’s little evidence of that in recent years—then they’ll buy plenty of F-35s. For Australia, that’s a good thing.
As a footnote, I’ll note the sparse data on defence projects that Australian taxpayers get compared to the quality and quantity of information provided to the American public.