This week’s graphs illustrate the importance of data in settling some historical debates. I was fortunate recently to have a chat with US military historian Williamson Murray. We got talking about some of his early work on air power in WWII, and he mentioned in passing the fine work on the German war economy that had been done by economic historian Adam Tooze in his 2006 book The Wages of Destruction: the making and breaking of the Nazi economy.
As it happens, I had a copy of that book on my ever growing ‘must get around to’ shelf. I should have got around to it earlier—as it happens it settles quite definitively a debate that has been going on since 1945 regarding the effectiveness of the allied bombing of Germany during WWII.
In a way, this shouldn’t really have been a debate. A 1947 study of the effects of the campaign was carried out by the United States Bombing Survey team, directed by leading US economist J. K. Galbraith. In their summary report, they made it clear that the campaign had been devastatingly effective:
[By] the beginning of 1945, before the invasion of the homeland itself, Germany was reaching a state of helplessness. Her armament production was falling irretrievably, orderliness in effort was disappearing, and total disruption and disintegration were well along. Her armies were still in the field. But with the impending collapse of the supporting economy, the indications are convincing that they would have had to cease fighting—any effective fighting—within a few months. Germany was mortally wounded.
And yet, today there is still equivocation on the subject, as reflected in this Wikipedia entry. I think there are a couple of reasons for that. First, I think there’s a reluctance to believe that the bombing was successful because of the moral hazards in benefitting from the deliberate targeting of civilian centres. And secondly, there’s a plausible—if initially counterintuitive—argument that bombing increased the production of war materiel. In the 1950s, Galbraith himself gave an example in which the destruction of civil industry during one particularly damaging raid caused displaced civilian production to shift to the war sector instead. He was making a micro level observation, but the same argument can be (mistakenly, as it happens) transferred to the macro level. (As is done here.)
To see how, look at the graph below (click to enlarge). It shows (in blue) the tonnage of bombs dropped on German targets by allied forces in World War II. After a slow beginning, the allied bomber offensive ramps up considerably from 1942 onwards, reaching a peak in 1944. Lacking anything like the precision targeting abilities of today, the campaign involved area bombing of German cities. While there were attempts to focus on industrial areas, especially in the daylight attacks, by night the target was usually the broad urban area.
The other quantity plotted (in red) is the production of fighter aircraft by German industry over the same period. The statistical correlation between the two is a very substantial 79%—apparently giving credence to the notion that the two are closely related. But as every first year statistics student should know, correlation doesn’t imply causation, and we need to look a bit closer.
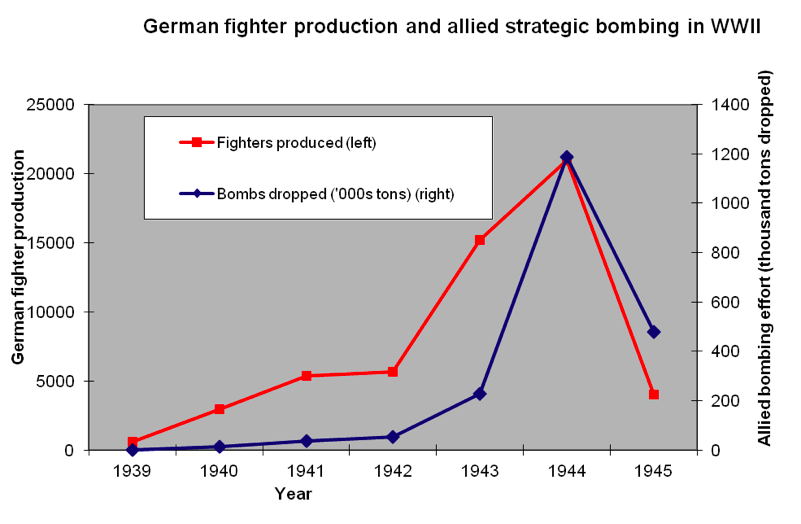
Sources: US strategic bombing survey 1947; William Green, Warplanes of the Third Reich.
Of course, at one level there is causation—the production of fighters as a defensive measure was given higher priority in response to the bombing campaign. In that case the production rate would be expected to ramp up. So how do we decide whether the bombing was helping or hindering the German war effort? One way is to look at the total war production and see how that was affected. An aggregate measure over many different outputs is itself a bit tricky, but Tooze provides the necessary data from original German records. As well, we can look not at what happened, but what didn’t happen—which takes us into the world of counterfactual history. That’s where Tooze’s careful work with primary documents lets us decide who is right.
The graph below tells the story. It shows German military production figures, indexed against the value at the start of 1942. For eighteen months, production grew at an extraordinary 5.5% per month. There were plans to accelerate production further in the second half of 1943, and planning figures showed that this was feasible given the raw material inputs and industrial resources available. In the middle of 1943, the so-called ‘Battle of the Ruhr’ began, when (mainly) the RAF threw its bomber fleet against German industrial cities. The result is clear and the data doesn’t lie—we can continue to debate the morality of the WWII bombing campaign, but the case for its effectiveness has been made.
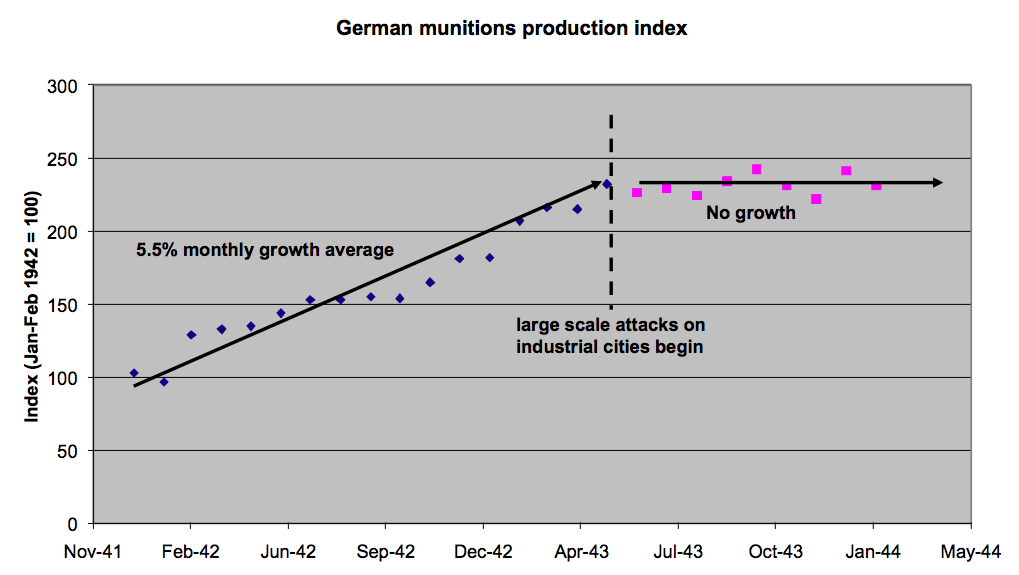
Source: German records, as reproduced in Tooze, Wages of destruction.
Andrew Davies is senior analyst for defence capability at ASPI and executive editor of The Strategist.