Way back when, we started our professional lives in theoretical physics. And sometimes it shows; we’ve never met a data set we didn’t like, and from time to time there’s an outbreak of ‘let’s see what we can do with this’.
So it was with the database of more than a quarter of a million contracts let by Defence or the then defence Materiel Organisation between 2007 and 2014. As well as being a useful source of information about expenditure on particular items or projects—thus offsetting to some extent the lamentable lack of transparency that’s otherwise the case from Defence—there’s enough data there to conduct some macro analysis.
With such a large data set, we can check that the overall statistical properties are what we’d expect. If we were to find any anomalies, we’d have an interesting line of investigation regarding Defence’s contracting practices. As it happens, we didn’t turn up anything untoward, which is reassuring, but we did manage to demonstrate a couple of interesting mathematical properties of the data set. (You can take the boys out of the physics department…)
The first observation concerns the distribution of contracts by value. It’s not surprising that there are fewer contracts as the value increases, but it is surprising just how predictable the numbers are. The graph below plots the number of DMO projects between $10 million and $100 million (in bands of $10 million) over the period 2007 to 2014. All nine data points are remarkably well fitted by a simple Power Law function with only two parameters. That means that knowing any two values on the curve allows us to predict any other. For example, if we know how many contracts were let between $10–20 million and $20–30 million, we can predict the number between $70–80 million with high confidence. (For the statistically minded, the regression value is 0.9824.)
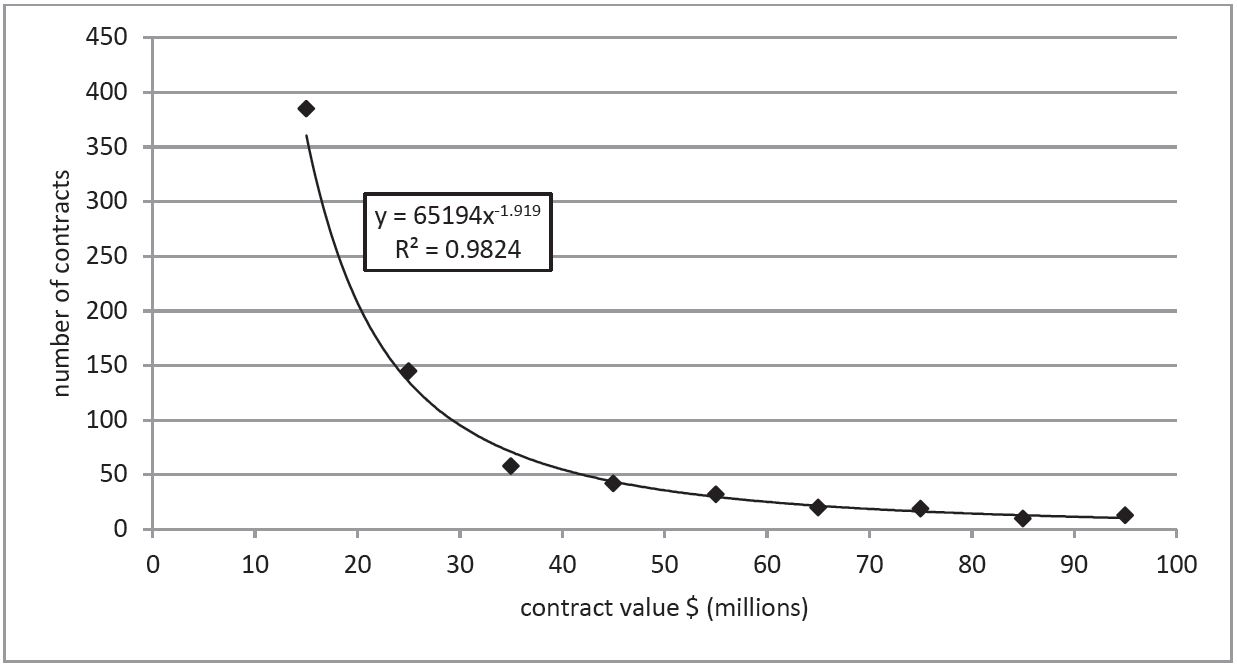
The obvious question is why? It turns out that this is a general property of large data sets with a couple of not-so-unusual properties and Power Law distributions are common in science and economics. In the late 19th century and early 20th centuries, Power Law distributions were observed in income distributions (Pareto), word frequencies (Zipf’s law) and the distribution of population size in cities (another Zipf’s law, explained in a technical paper here (PDF). Journal citations, book sales, earthquake magnitudes, company size, stock market movements, web hits, individual net worth, executive remuneration and even the diameter of craters on the moon (PDF) follow the same pattern.
It’s not entirely clear (at least to us) what aspects of Defence contracting cause it to fit the power law model—though it’s possible that the distribution of contract size mirrors the distribution of the size of firms that are counterparties to the contracts, which is known to follow a power law (PDF). (You can find a more thorough discussion in chapter nine of this year’s ASPI budget brief.)
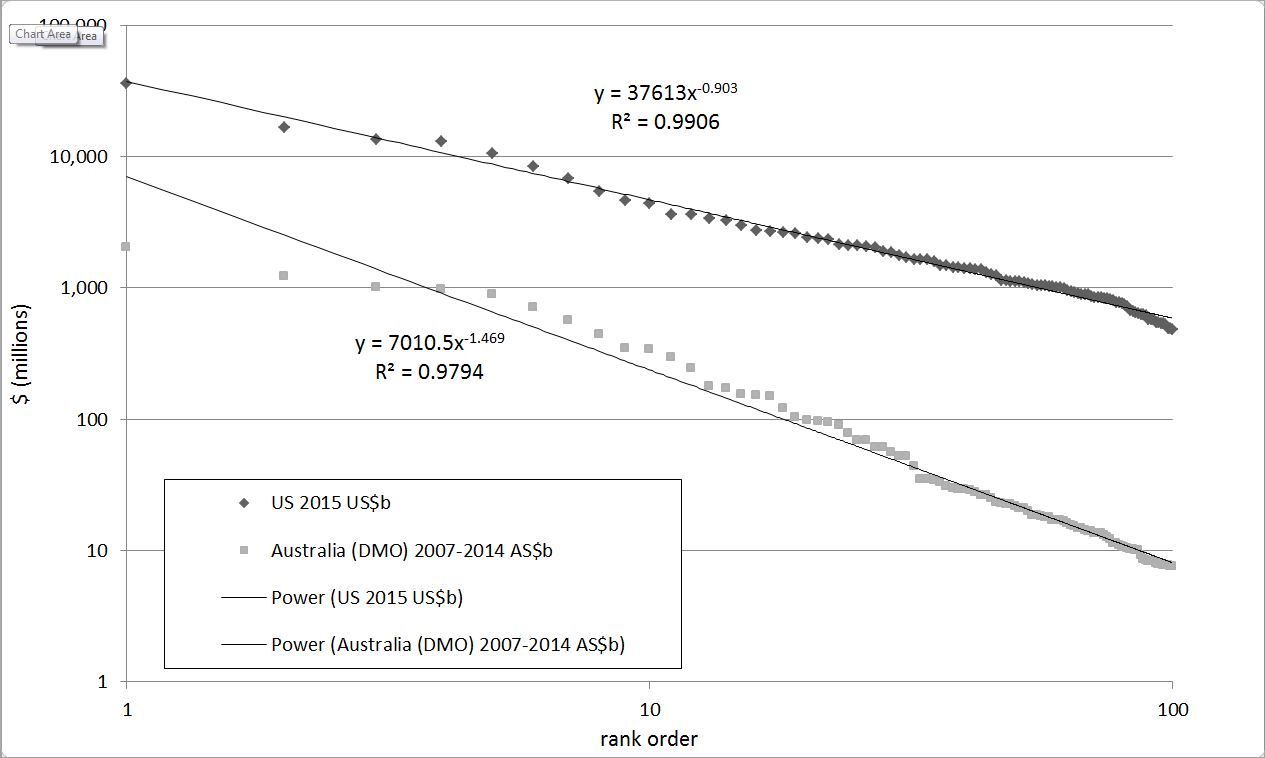
Regardless of the reason, the distribution does what it ought to, and it also mirrors the distribution of contracts let by the US government. Presenting the data in a slightly different way, the graph below shows the value of the top 100 contracts let by the US government and by DMO, ordered by contract size. The scale is different (the largest American contract is US$36.3 billion to Lockheed Martin, while Australia’s largest is a little over AU$4 billion as part of the air warfare destroyer project) but both follow a power law with more than 97% correlation.
One other property we can check is a quirky aspect of many data sets known as Benford’s Law, which concerns the leading digits of entries in the data. The law says that the leading digit is more likely to be a ‘1’ than any other digit, that ‘2’ is the next most likely, and so on, in a predictable relative frequency. It’s not intuitively obvious, but it’s a common enough pattern that it can even be used for forensic accounting (recommended video); people fiddling the books tend to distribute their dodgy numbers in a non-Benford pattern. (And if the first digit doesn’t betray them, the second or third will.)
The graph below shows how DMO’s contracts stack up against Benford’s Law. It’s not an exact match, but the relative frequency falls off progressively by digit as expected. The difference is probably due to threshold effects in the contracting and approvals system—a glance at the raw data shows a sudden leap in the number of contracts at $10,000, for example.
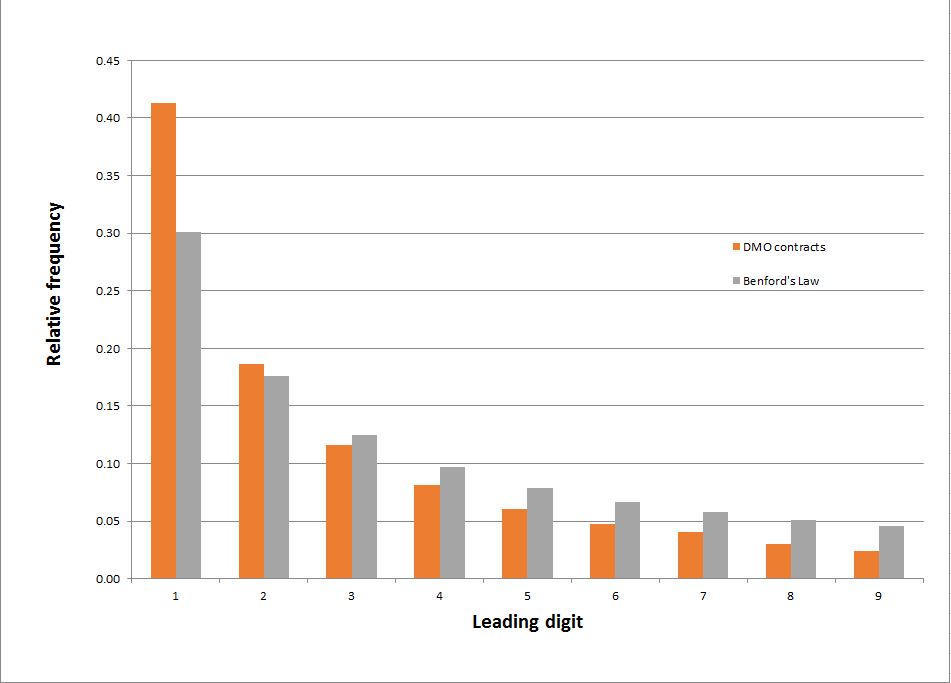
Source: ASPI analysis of AusTender database.
Overall, our analysis results in what a scientist would call a ‘null result’. That is, there’s no clear evidence of anything beyond the ability of mundane explanations to describe. In this case that’s a good thing—we don’t want to find exotic phenomena in Defence’s spending habits!